Alice au pays d’OpenTelemetry
OpenTelemetry c’est :
Un standard de donnée
Une convention de désignation d’une ressource
Des implémentations d’instrumentation de code disponibles dans plusieurs languages.
Un collecteur magique

Jérôme
Tech Lead / Architecte
![]() onepoint
onepoint
@jtama ![]()
Un matin de Mai 2022


Le collecteur magique


receivers:
  prometheus:
    config:
      scrape_configs:
        - job_name: metrics-collector
          scrape_interval: 5s
          // Defaults to /metrics
          metrics_path: '/q/metrics'
          scheme: http
          static_configs:
            - targets: ['mon-app-1:8080']
processors:
  batch:
  memory_limiter:
    check_interval: 5s
    limit_mib: 1500
    spike_limit_mib: 512

exporters:
  logging:
    loglevel: debug
  prometheus:
    endpoint: :9090
    resource_to_telemetry_conversion:
      enabled: true

service:
  pipelines:
    metrics:
      receivers: [prometheus]
      processors: [batch,memory_limiter]
      exporters: [logging, prometheus]


OpenTelemetry N’EST PAS un backend de persistence.
receivers:
  prometheus:
    config:
      scrape_configs:
        - job_name: metrics-collector
          scrape_interval: 5s
          metrics_path: '/q/metrics'
          scheme: http
          static_configs:
            - targets: ['mon-app-1:8080', 'mon-app-2:8080']
processors:
  batch:
  memory_limiter:
    check_interval: 5s
    limit_mib: 1500
    spike_limit_mib: 512

exporters:
  logging:
    loglevel: debug
  prometheus:
    endpoint: prometheus:9090
    resource_to_telemetry_conversion:
      enabled: true

service:
  pipelines:
    metrics:
      receivers: [prometheus]
      processors: [batch,memory_limiter]
      exporters: [logging, prometheus]
Les ressources c’est la vie.
Refactoring time !
Utilisation de l’operator OpenTelemetry, pour me faciliter la vie.
Sidecar !
Je décide de conserver un collector maître, qui rassemblera toutes les collectes…

Le sidecar
receivers:
  prometheus:
    config:
      scrape_configs:
        - job_name: mon-app
          scrape_interval: 5s
          metrics_path: '/q/metrics'
          scheme: http
          static_configs:
            - targets: [ 'localhost:8080' ]
              labels:
                instance: mon-app
processors:
  batch:
  memory_limiter:
    check_interval: 5s
    limit_mib: 1500
    spike_limit_mib: 512
  k8sAttributes:
exporters:
  otlp:
    endpoint: main-collector
    tls:
      insecure: true
service:
  pipelines:
    metrics:
      receivers: [ prometheus ]
      processors: [ k8sAttributes, batch, memory_limiter ]
exporters: [ otlp ]Le collecteur maître
receivers:
  otlp:
    protocols:
      grpc:
      http:

processors:
  batch:
  memory_limiter:
    check_interval: 5s
    limit_mib: 1500
    spike_limit_mib: 512

exporters:
  logging:
    loglevel: debug
  prometheus:
    endpoint: prometheus:9090
    resource_to_telemetry_conversion:
      enabled: true

service:
  pipelines:
    metrics:
      receivers: [ otlp ]
      processors: [ batch, memory_limiter ]
      exporters: [ logging, prometheus ]
As a sidecar
The processor does not support detecting containers from the same pods when running as a sidecar. While this can be done, we think it is simpler to just use the kubernetes downward API to inject environment variables into the pods and directly use their values as tags.
— La documentation de `k8sattributeprocessor`
RTFM !!!
receivers:
  prometheus:
    config:
      scrape_configs:
        - job_name: ${module}
          scrape_interval: 5s
          metrics_path: '/q/metrics'
          scheme: http
          static_configs:
            - targets: [ 'localhost:8080' ]
              labels:
                instance: mon-app
processors:
  batch:
  memory_limiter:
    check_interval: 5s
    limit_mib: 1500
    spike_limit_mib: 512
  resourcedetection:
    detectors: [ env ]
exporters:
  otlp:
    endpoint: main-collector
    tls:
      insecure: true
service:
  pipelines:
    metrics:
      receivers: [ prometheus ]
      processors: [ resourcedetection, batch, memory_limiter ]
exporters: [ otlp ]Custom
| application | Le nom de mon module |
| instance | Son instance dans le cluster |
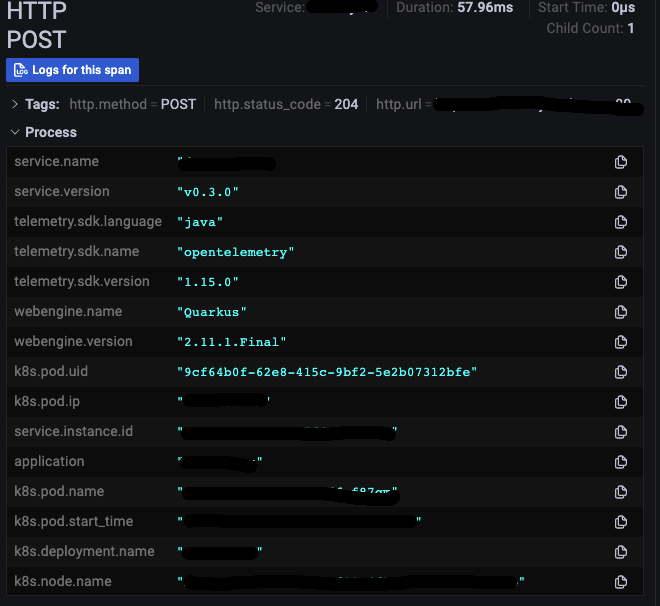
OpenTelemetry
| service_instance_id | L’id unique de l’instance |
| service_name | Le nom du module |
| service_namespace | Le nom du system auquel il appartient |
| service_version | La version |
Kubernetes
| k8s_deployment_name | Le nom du déploiement |
| k8s_namespace_name | Le namespace |
| k8s_node_name | Le noeud sur lequel tourne l’instance |
| k8s_pod_ip | Son ip |
| k8s_pod_name | Le nom du pod |
| k8s_pod_start_time | La date et heure de démarrage de l’instance |
| k8s_pod_uid | Son id |
Le sidecar
receivers:
  otlp:
    protocols:
      grpc:
      http:
  prometheus:
    config:
      scrape_configs:
        - job_name: ${module}
          scrape_interval: 5s
          metrics_path: '/q/metrics'
          scheme: http
          static_configs:
            - targets: [ 'localhost:8080' ]
              labels:
                instance: mon-app
processors:
  batch:
  memory_limiter:
    check_interval: 5s
    limit_mib: 1500
    spike_limit_mib: 512
  resourcedetection:
    detectors: [ env ]
exporters:
  otlp:
    endpoint: main
    tls:
      insecure: true
service:
  pipelines:
    metrics:
      receivers: [ prometheus ]
      processors: [ resourcedetection, batch, memory_limiter ]
      exporters: [ otlp ]
    traces:
      receivers: [ otlp ]
      processors: [ resourcedetection, batch, memory_limiter ]
      exporters: [ otlp ]
Le collecteur principal
receivers:
  otlp:
    protocols:
      grpc:
      http:

processors:
  batch:
  memory_limiter:
    check_interval: 5s
    limit_mib: 1500
    spike_limit_mib: 512
  k8sAttributes:

exporters:
  logging:
    loglevel: debug
  prometheus:
    endpoint: prometheus:9090
    resource_to_telemetry_conversion:
      enabled: true
  otlp:
    endpoint: Encore un truc à déployer...

service:
  pipelines:
    metrics:
      receivers: [ prometheus ]
      processors: [ k8sAttributes, batch, memory_limiter ]
      exporters: [ logging, prometheus ]
    traces:
      receivers: [ otlp ]
      processors: [ k8sAttributes, batch, memory_limiter ]
      exporters: [ otlp ]
Tout ce qui a déjà été fait n’est plus à faire.
Le Daemonset
Attention, pour déployer un Daemonset utilisable, vous devez disposer de droits élévés sur le cluster |

Mais pourquoi tu ne passes pas par ton collecteur pour enrichir tes logs ?
2 décembre 2022
— Question judicieuse
— Question judicieuse

receivers:
  filelog:
    include:
      - /var/log/pods/namespace_name*/*/*.log
    exclude:
      - /var/log/pods/*daemonset-collector*/*.log
      - /var/log/pods/*/otc-container/*.log
    start_at: beginning
    include_file_path: true
    include_file_name: false
    operators:
      - type: router
        id: get-format
        routes:
          - output: parser-crio
            expr: 'body matches "^[^ Z]+ "'
          - output: parser-containerd
            expr: 'body matches "^[^ Z]+Z"'
      //  Parse CRI-O format
      - type: regex_parser
        id: parser-crio
        regex: '^([^ Z]+) (stdout|stderr) ([^ ]*) ?(?P<log>.*)$'
        output: extract_metadata_from_filepath
        timestamp:
          parse_from: attributes.time
          layout_type: gotime
          layout: '2006-01-02T15:04:05.000000000-07:00'
      //  Parse CRI-Containerd format
      - type: regex_parser
        id: parser-containerd
        regex: '^([^ ^Z]+Z) (stdout|stderr) ([^ ]*) ?(?P<log>.*)$'
        output: extract_metadata_from_filepath
      //  Extract metadata from file path
      - type: regex_parser
        id: extract_metadata_from_filepath
        regex: '^.*\/(?P<namespace>[^_]+)_(?P<pod_name>[^_]+)_(?P<uuid>[a-f0-9\-]{36})\/(?P<container_name>[^\._]+)\/(\d+)\.log$'
        parse_from: attributes["log.file.path"]
      //  Clean up log body
      - type: move
        from: attributes.log
        to: body
      - type: move
        from: attributes.pod_name
        to: resource.pod_name
      //  Recognize different types of modules
      - type: router
        routes:
          - output: extract-java-log
            expr: 'attributes.container_name matches "^java-"'
          - output: extract-nginx-log
            expr: 'attributes.container_name matches "^front"'
          - output: extract-elastic-log
            expr: 'attributes.container_name matches "^elasticsearch"'
          - output: extract-kafka-log
            expr: 'attributes.container_name matches "^kafka"'
      //  Start java
      - type: recombine
        id: extract-java-log
        combine_field: body
        is_first_entry: body matches "^[\\d]"
        source_identifier: attributes["log.file.path"]
      - type: regex_parser
        parse_from: body
        regex: '^(\d\d:\d\d:\d\d+) (?P<severity>\w+)\w*'
        severity:
          parse_from: attributes.severity
        output: passthrough //  Goto end
      //  End java
      //  Start nginx
      - type: regex_parser
        id: extract-nginx-log
        output: passthrough //  Goto end
        parse_from: body
        regex: '\d{1,3}\.\d{1,3}\.\d{1,3}\.\d{1,3} - - \[\d{2}\/[a-zA-Z]{3}\/\d{4}:\d{2}:\d{2}:\d{2} [\+|\-]\d{4}\] \"(GET|POST|PUT|PATCH|DELETE|OPTION) .+ HTTP\/1\.1" (?P<statuscode>\d{3}) .*'
        severity:
          parse_from: 'attributes.statuscode'
          mapping:
            warn: 5xx
            error: 4xx
            info: 3xx
            debug: 2xx
      //  End Nginx
      //  Start elastic
      - type: router
        id: extract-elastic-log
        routes:
          - output: extract-elastic-json-log
            expr: 'body matches "^(\"|{)"'
          - output: extract-elastic-flat-log
            expr: 'body matches "^[A-Z]+:"'
      - type: recombine
        id: extract-elastic-json-log
        combine_field: body
        is_first_entry: body matches "^{"
        source_identifier: attributes["log.file.path"]
      - type: regex_parser
        id: extract-elastic-json-severity
        output: passthrough //  Goto end
        parse_from: body
        regex: '"level": "(?P<severity>\w+)"'
      - type: regex_parser
        id: extract-elastic-flat-log
        parse_from: body
        regex: '^(?P<severity>\w*):.*'
      //  End elastic
      //  Start kafka
      - type: router
        id: extract-kafka-log
        routes:
          - output: extract-kafka-java-log
            expr: 'body matches "^\\d|\\s"'
          - output: passthrough
            expr: 'body matches ".+"' //  If it's not java...
      - type: recombine
        id: extract-kafka-java-log
        combine_field: body
        is_first_entry: body matches "^\\d"
        source_identifier: attributes["log.file.path"]
      - type: regex_parser
        output: passthrough //  Goto end
        parse_from: body
        regex: '^\d{4}-\d{2}-\d{2} \d{2}:\d{2}:\d{2},\d{3} (?P<severity>\w+)'
      //  End kafka
      - type: filter
        id: passthrough
        expr: 'body == null'
processors:
  transform:
    logs:
      statements:
        - replace_match(attributes["severity"], "WARNING", "WARN")
        - replace_match(attributes["severity"], "DEPRECATION", "WARN")
  attributes:
    actions:
      - key: log.file.path
        action: delete
      - key: uuid
        action: delete
      - key: statuscode
        action: delete
      - key: loki.attribute.labels
        value: k8s_namespace_name, service_name, level
        action: insert
exporters:
  logging:
    logLevel: debug
  loki:
    endpoint: http://yap-tools-loki-distributed-distributor:3100/loki/api/v1/push
    headers:
      "X-Scope-OrgID": tenantID
service:
  telemetry:
    logs:
      level: "DEBUG"
      development: true
      encoding: "console"
  pipelines:
    logs:
      receivers: [filelog]
      processors: [attributes, transform]
exporters: [logging, loki]Et la corrélation ?
OpenTelemetry ne fait pas tout.
Merci !

Credits: animationscreencaps.com, opentelemetry.io